Western snowpack is something we've wanted to dig into properly for a while. We have the data — years of SNOTEL records sitting in our database — and the question of whether peak snowpack has actually shifted over time seemed worth exploring systematically. When you sit down with 44 years of records across 411 stations in 12 states, the picture is more nuanced — and in some ways more interesting — than a simple trend line up or down.
We pulled the full historical daily dataset from our SNOTEL database: 11.76 million rows spanning 1963–2026, covering all 911 stations in the network. For trend analysis we narrowed to the 411 stations that were active and recording SWE by 1981, which gives a consistent 45-year window across all states. The analysis asks three questions: Has peak SWE magnitude changed? Has peak timing shifted? And does elevation amplify either trend?
Question 1 — Has Peak SWE Magnitude Changed?
Across all 411 stations, network-wide median peak SWE has declined by about 12.6% over the 44-year period. That sounds significant until you see the p-value: 0.27 — not statistically significant. Year-to-year variability driven by drought and wet cycles creates enough noise that the overall decline doesn't clear the significance threshold at the network level.
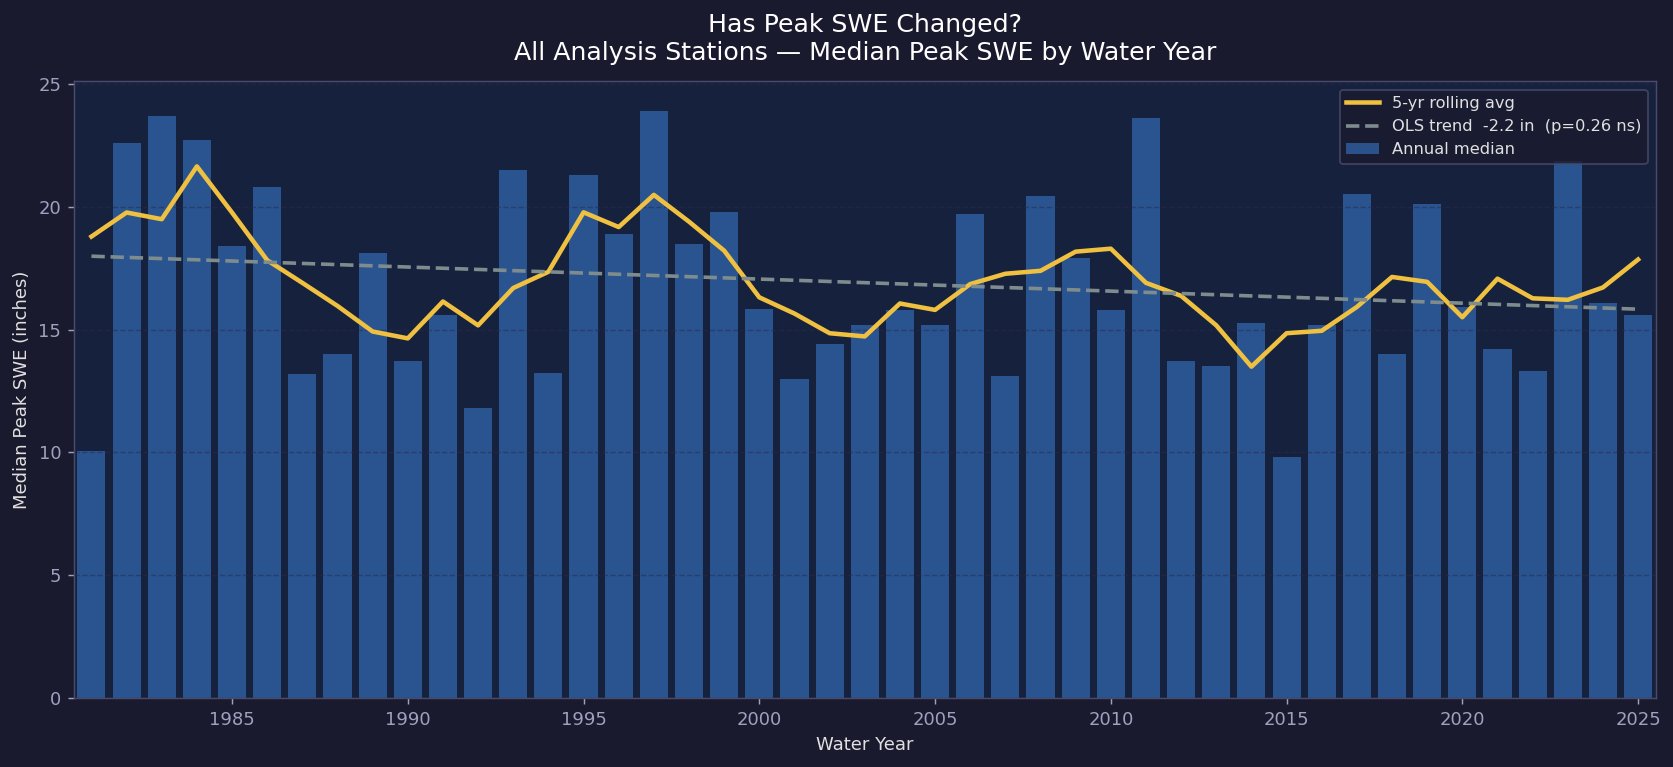
Fig 1 — Network-wide median peak SWE by water year · 5-yr rolling avg (gold) · OLS trend -2.2 in (p=0.26 ns) · 411 stations across 12 states
The 5-year rolling average in Fig 1 tells the real story. The oscillation between roughly 14 and 21 inches reflects large-scale drought and wet cycles more than a clean downward trend. What's notable is that the post-2012 floor sits consistently below the 1980s average — the wet years still happen, but the floor on the bad years has dropped.
At the state level, the picture sharpens considerably. New Mexico is the clearest signal in the dataset, down from a median of roughly 11.4 inches to 6.9 inches — a 54.6% decline that clears statistical significance at p=0.003. Arizona shows a similar directional decline of 46.2%, marginally significant. Alaska is the only state with a statistically significant increase (+39.7%, p=0.019), consistent with shifting precipitation patterns at high latitudes. Most of the interior West — Montana, Idaho, Wyoming, Colorado, Oregon — shows declines in the 5–13% range that don't reach significance individually.
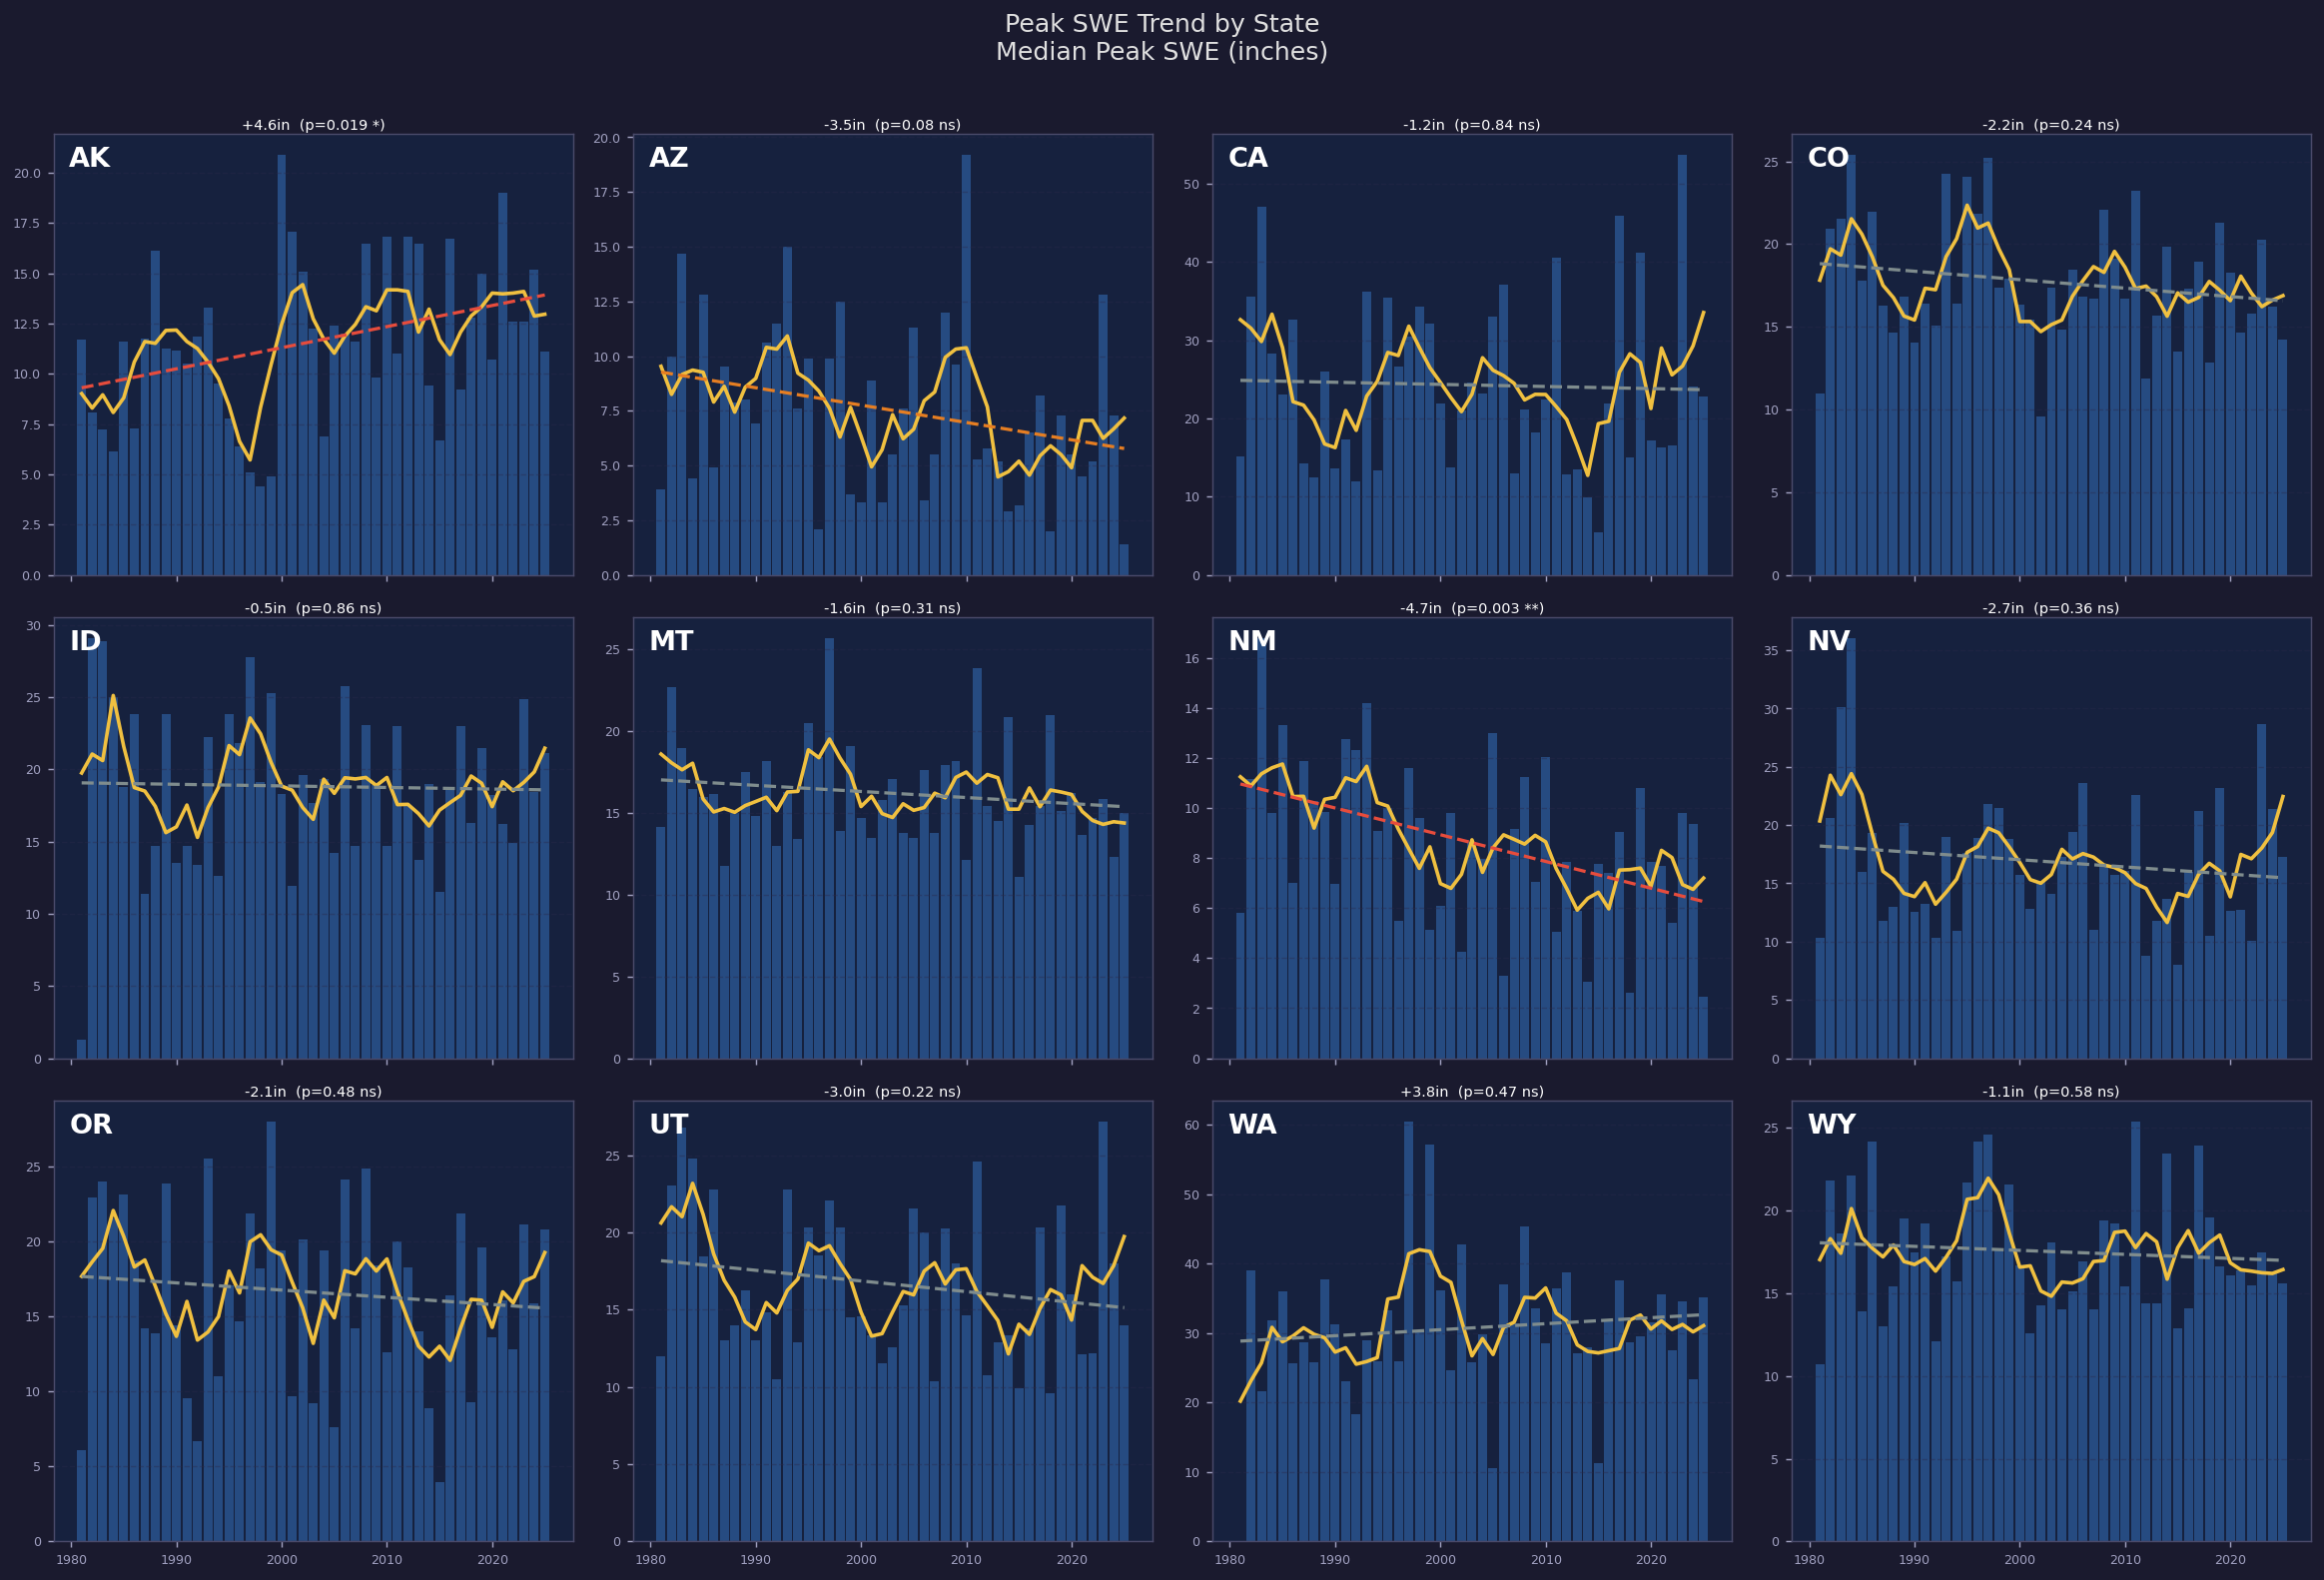
Fig 2 — Median peak SWE trend by state 1981–2025 · Red trend line = statistically significant (p < 0.05) · NM p=0.003, AK p=0.019
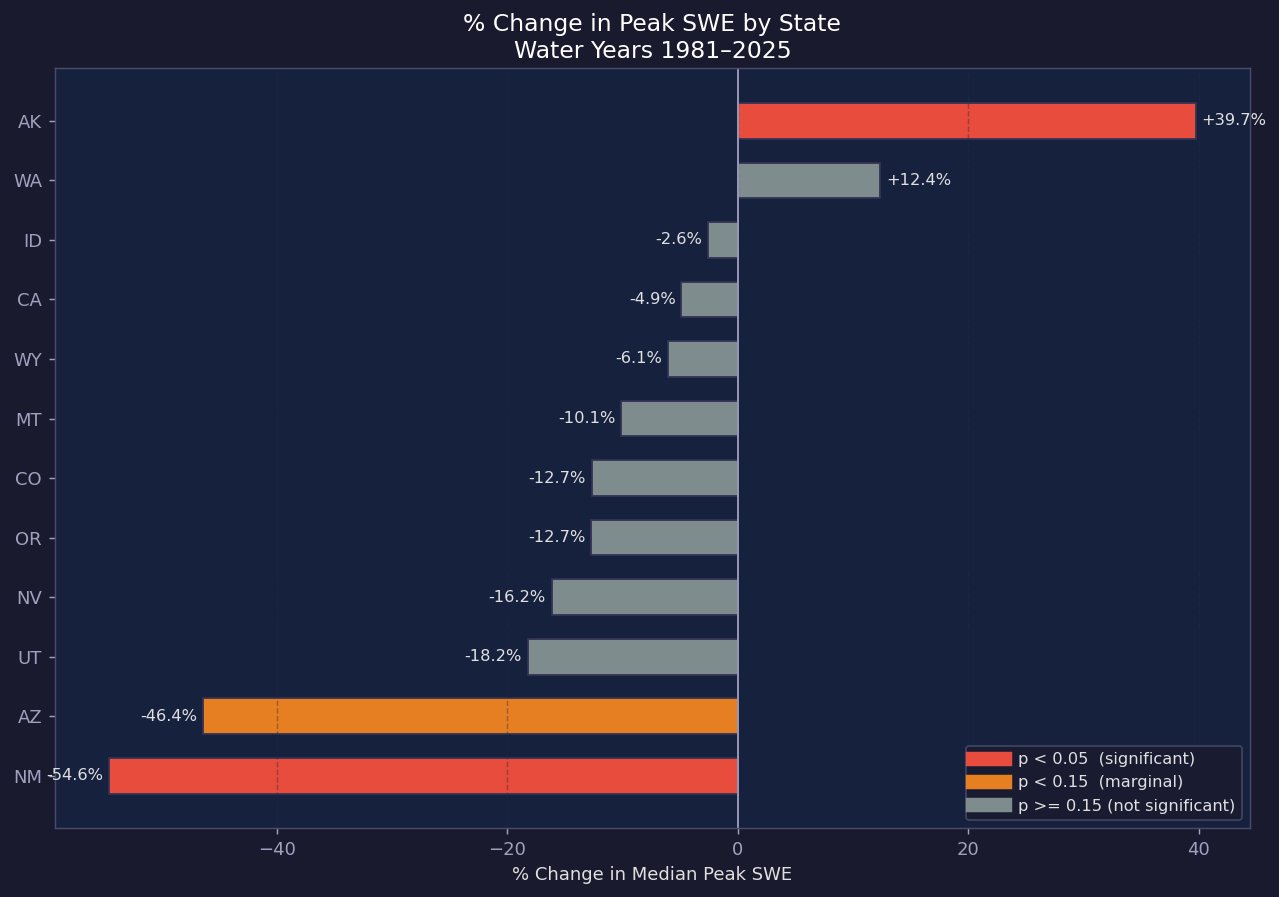
Fig 3 — % change in median peak SWE by state, water years 1981–2025 · Red = significant (p < 0.05) · Orange = marginal (p < 0.15)
Question 2 — Has Peak SWE Timing Shifted?
This is where the data gets more consistent and arguably more consequential. Network-wide, peak snowpack is arriving about 10 days earlier than it did in the early 1980s — from around April 13 to April 1. The p-value of 0.10 puts this right on the borderline of significance, but the state-level breakdown makes the pattern hard to dismiss.
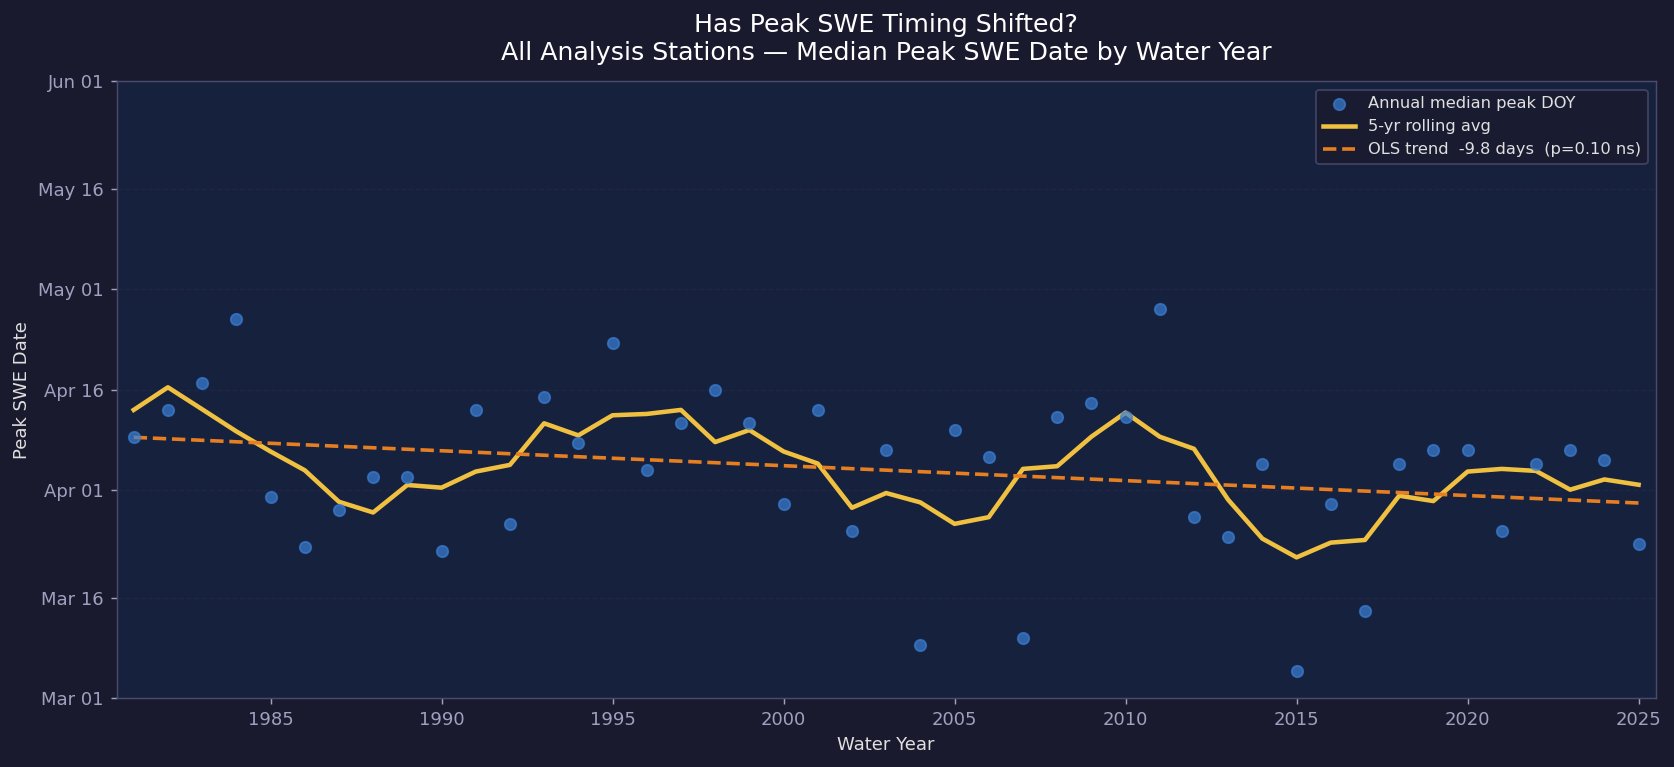
Fig 4 — Network-wide median peak SWE date by water year · OLS trend -9.8 days (p=0.10 borderline) · Apr 13 → Apr 1
Six of 12 states show statistically significant earlier peak timing. Idaho's 21-day shift (Apr 28 → Mar 29, p=0.037) is the most dramatic in the dataset. Arizona moved 23 days earlier (Feb 25 → Feb 11, p=0.012). Colorado, New Mexico, Utah, and Alaska all show significant shifts in the 10–16 day range. Montana is the primary outlier — a +2 day non-significant trend, essentially no change in peak timing over 44 years.
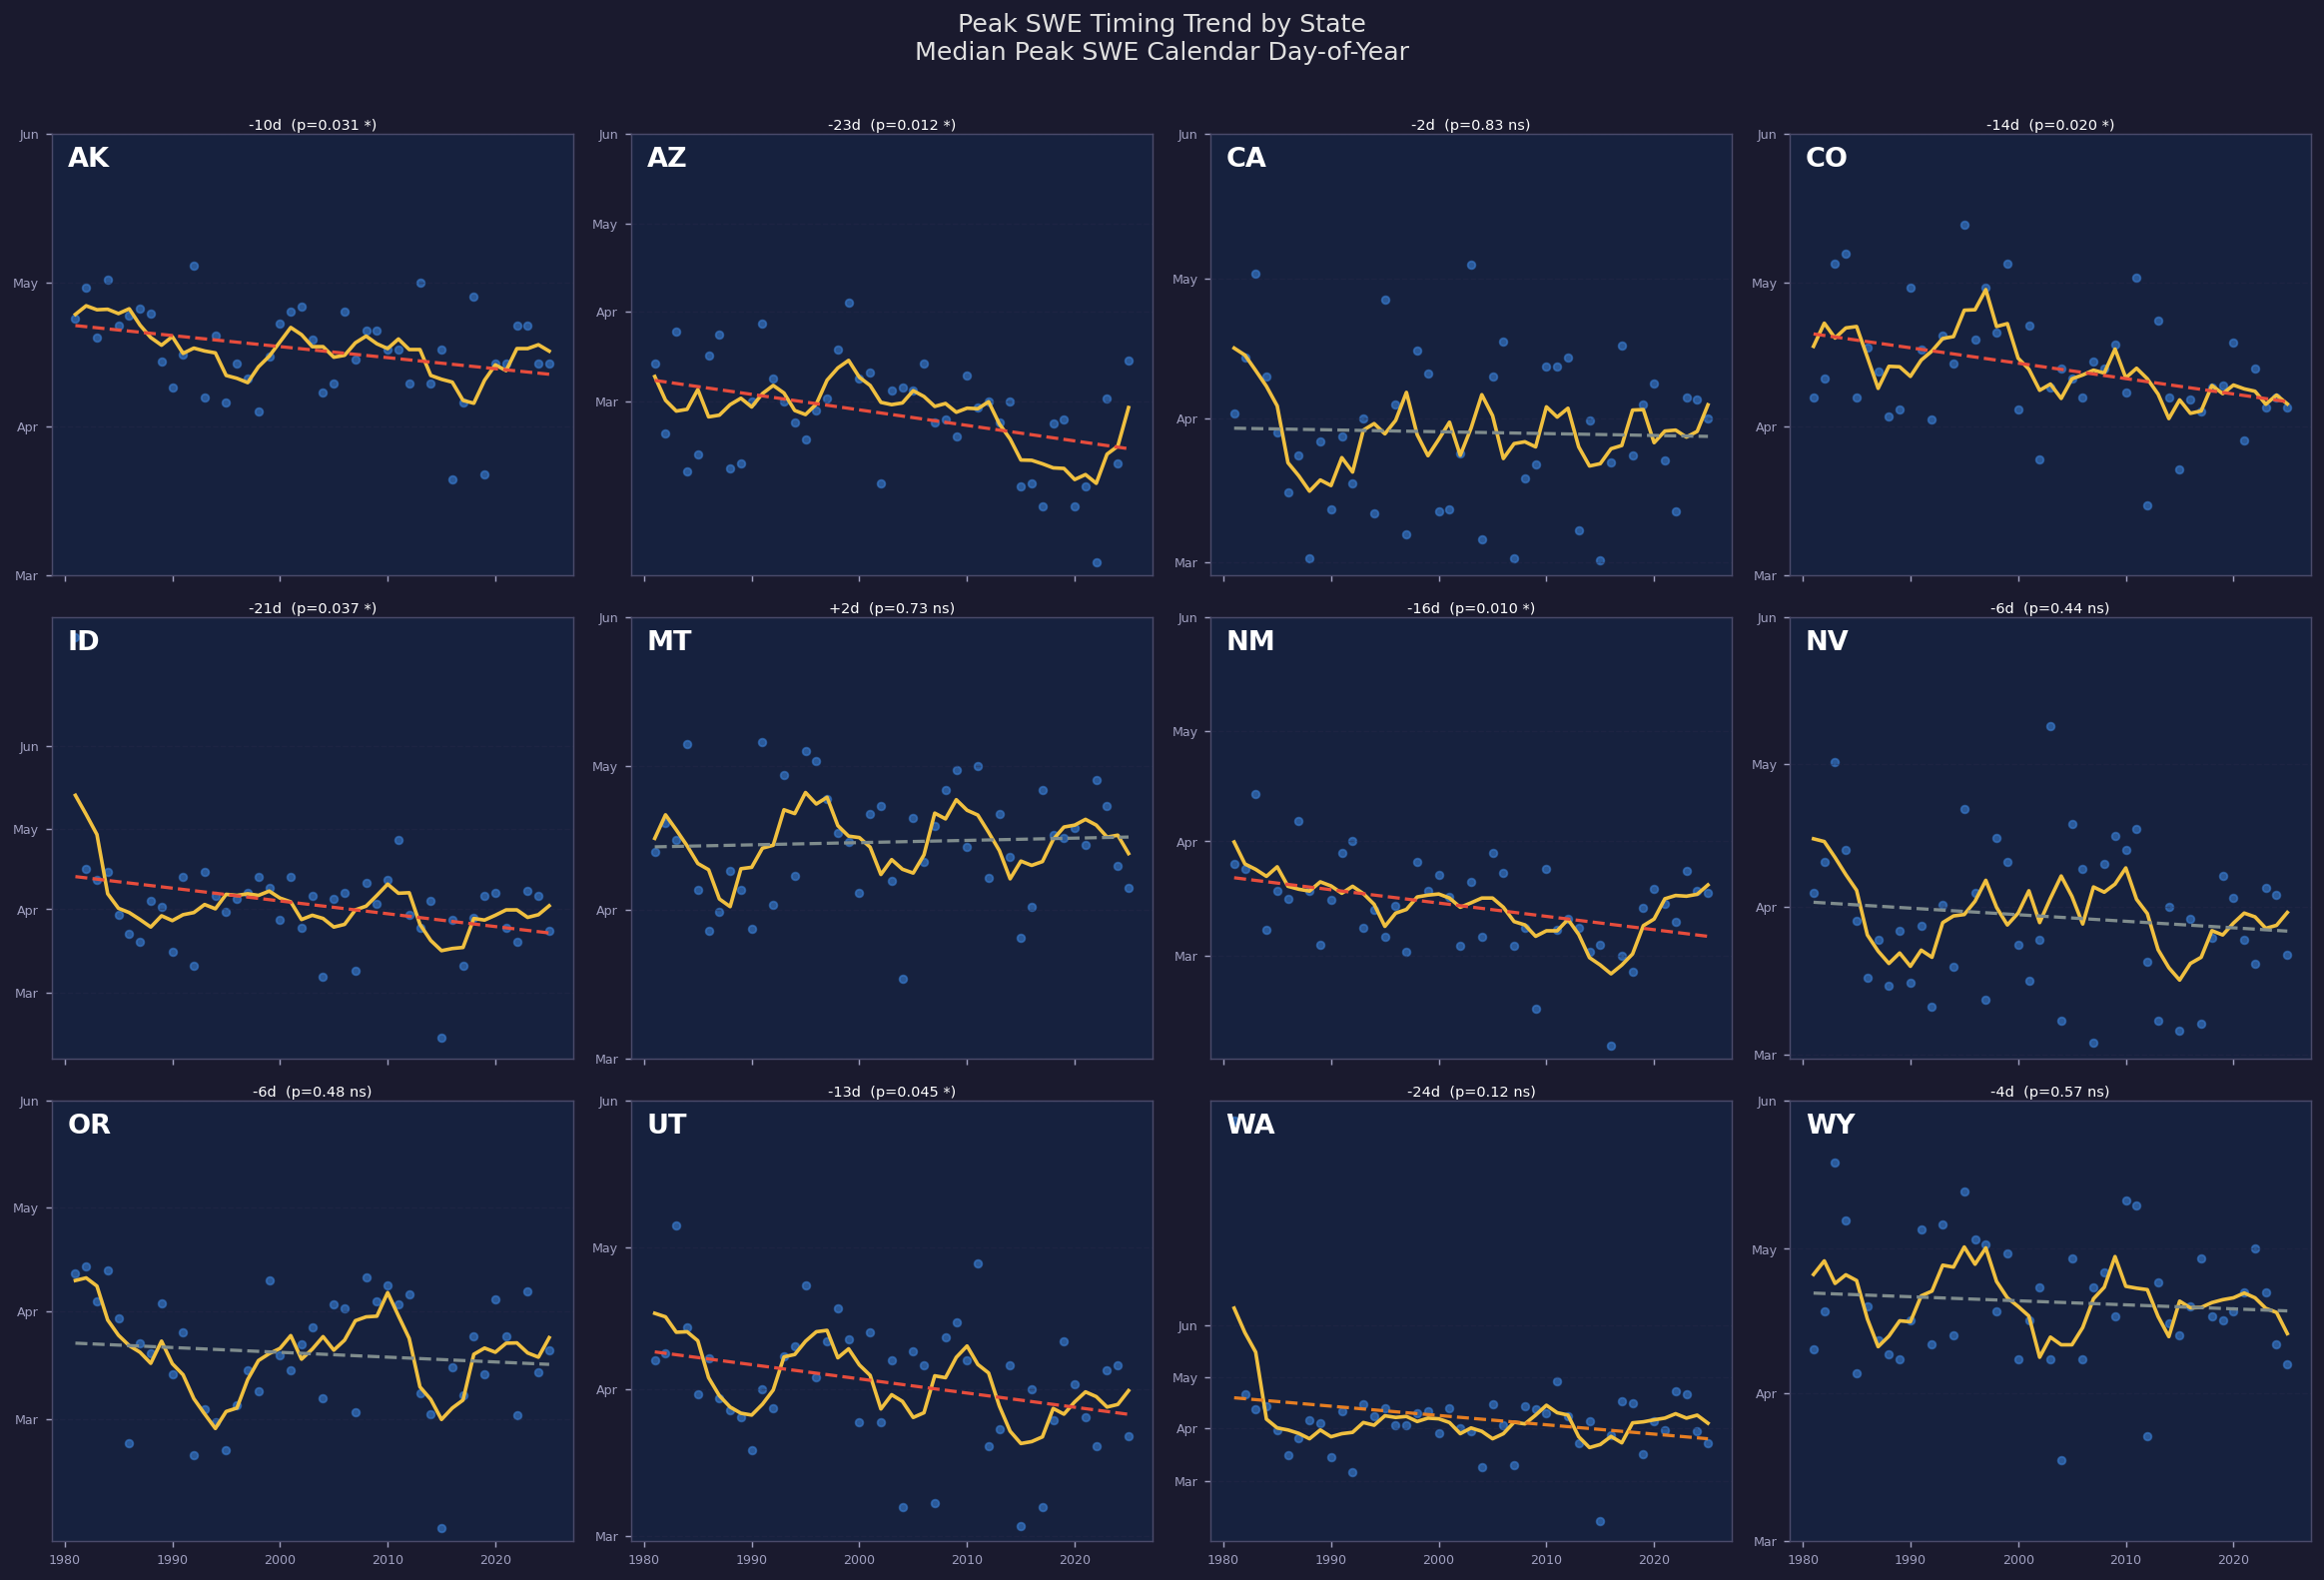
Fig 5 — Median peak SWE date trend by state 1981–2025 · Red trend line = statistically significant · MT is the notable outlier with effectively no shift
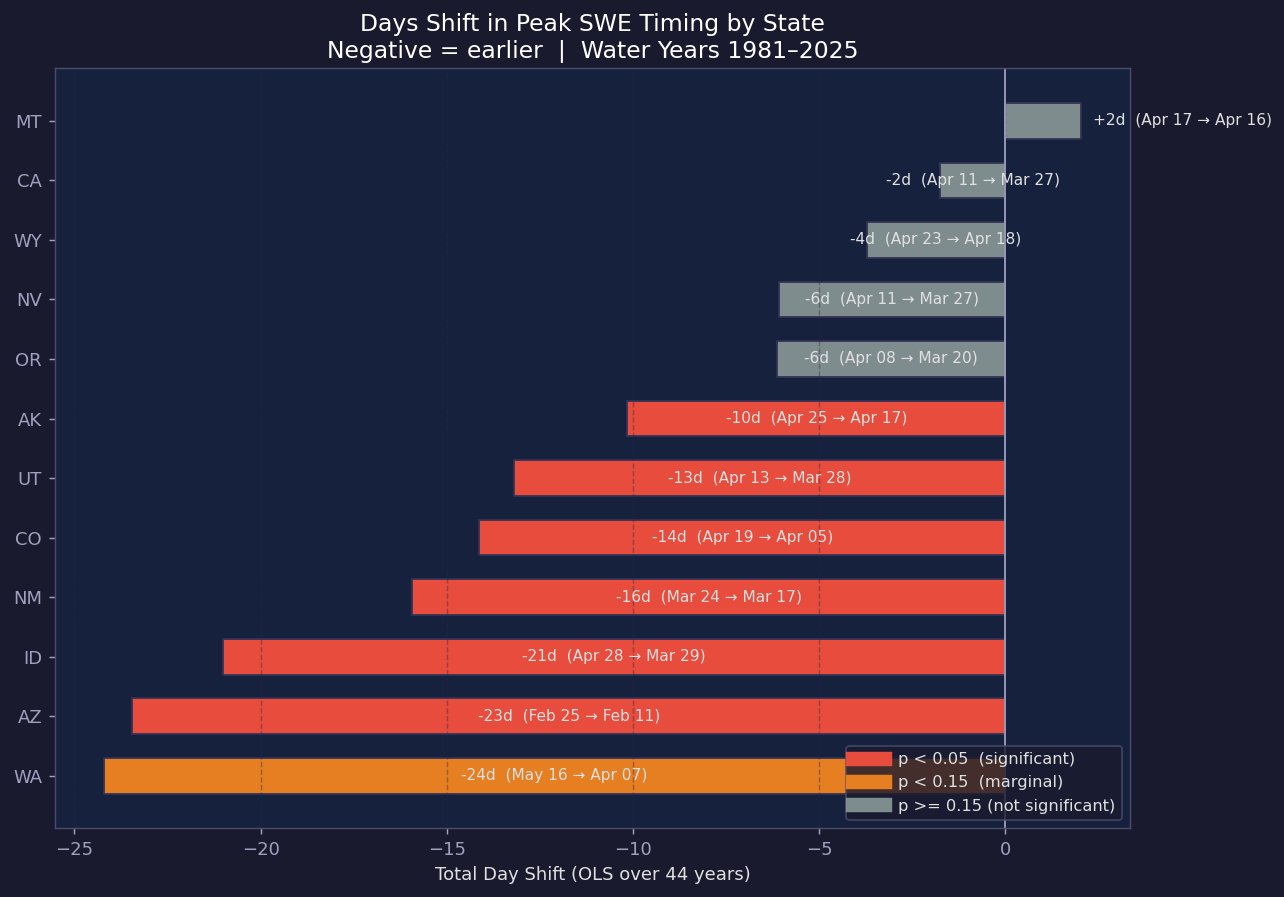
Fig 6 — Total day shift in peak SWE timing by state, 1981–2025 · Negative = earlier · Red = significant · WA -24d is marginal (p=0.12)
The practical implication of earlier peaks is not obvious from the numbers alone. A basin that peaks on March 29 instead of April 28 doesn't just have its runoff shifted a month earlier — it means snowmelt is occurring into soils and at temperatures that are often less favorable for retention. Earlier melt can mean faster runoff, less groundwater recharge, and rivers that drop sooner in summer even if total winter precipitation was average.
The Takeaway
The timing shift is the stronger and more consistent signal in this dataset. Even in years with adequate snowfall, peak SWE is arriving earlier across most of the West — and that shift has real downstream consequences for water management, reservoir operations, agriculture, and river recreation. The magnitude decline is real but noisy; the timing shift is quieter but arguably more structurally important.
It's worth noting that this analysis uses point data from individual SNOTEL stations. Each station represents a specific location, elevation, and aspect — it's not a spatially continuous picture of snowpack across the landscape. Patterns can vary meaningfully even between nearby stations, and the network has gaps, particularly at lower elevations. The trends here reflect what the station network captures, which skews toward mid-to-high elevation terrain.
Montana continues to stand out as an exception to both trends. Its peak timing has barely moved and its magnitude decline is modest and non-significant.