The western snowpack in mid-March 2026 is not a single story — it's two stories happening simultaneously and in sharp contrast to each other. Across Montana, Idaho, and Wyoming, 46 SNOTEL stations are running at or above 100% of their historical average SWE, many of them significantly so. In Oregon, California, Utah, and the southern Washington Cascades, the picture is dire: stations at 20% of normal, some at zero, others carrying less than a quarter of the water they typically hold at this point in the season. The map makes the divide impossible to miss.
The Winners: Montana, Idaho, and Wyoming
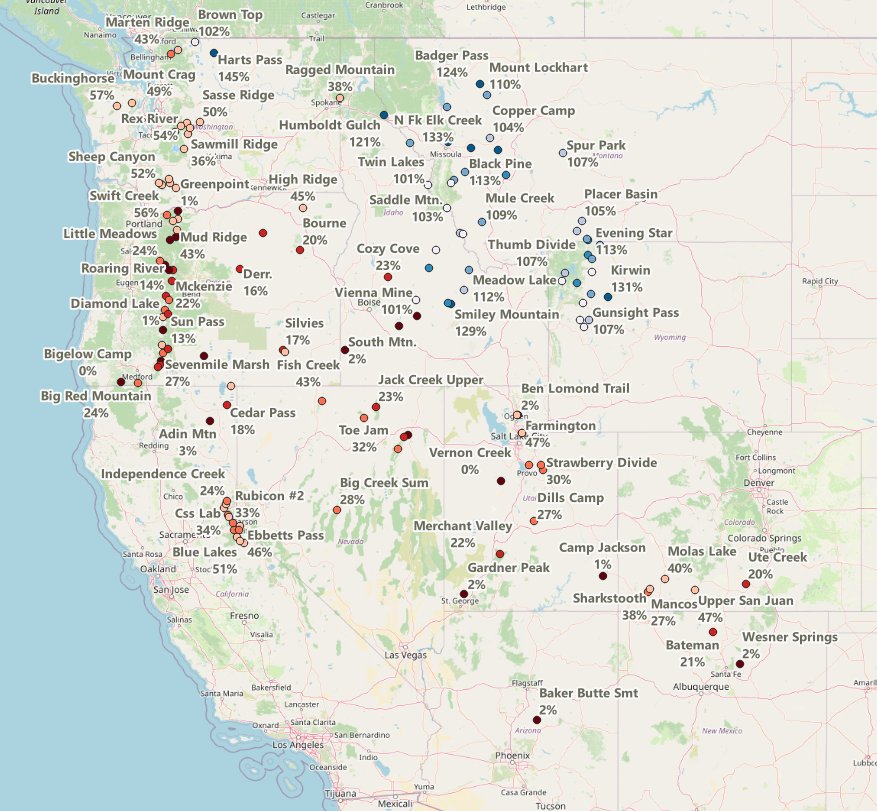
The interior ranges are having a good season. Montana leads with 23 stations above normal and an average reading well above 100% of the historical median. The western Montana mountains are particularly healthy — Stuart Mountain at 128% with 37.9 inches of SWE, Hoodoo Basin at 111% with 41.9 inches, Badger Pass near Glacier at 124%. Warm Springs and Nevada Ridge, both in central Montana, are running at 136% and 135% respectively, carrying substantially more water than their historical averages.
Harts Pass in the far north Washington Cascades is the single strongest reading in the network at 145% of normal and 58.7 inches of SWE — an outlier even among the winners. Brown Top, nearby, sits at 102% with the deepest raw snowpack in the above-normal dataset at 60.7 inches. These two stations are essentially their own microclimate, positioned to catch moisture from both Pacific and Canadian Arctic systems in a way that the rest of the Washington Cascades isn't.
Wyoming's above-normal stations are concentrated in the Absaroka and Wind River ranges at high elevation. Kirwin leads at 131%, Two Ocean Plateau at 116% with 31.8 inches. The Wyoming numbers reflect cold, high-altitude terrain that holds snow efficiently — once it falls at 9,000–10,000 feet in winter, it stays.
| Station | State | SWE | Hist. Avg | % of Normal |
|---|---|---|---|---|
| Harts Pass | WA | 58.7" | 40.6" | 145% |
| Warm Springs | MT | 25.9" | 19.1" | 136% |
| Nevada Ridge | MT | 18.9" | 14.0" | 135% |
| Kirwin | WY | 13.2" | 10.1" | 131% |
| Stuart Mountain | MT | 37.9" | 29.7" | 128% |
| Smiley Mountain | ID | 20.7" | 16.1" | 129% |
| Badger Pass | MT | 36.0" | 29.1" | 124% |
| Two Ocean Plateau | WY | 31.8" | 27.4" | 116% |
Oregon: Historically Low Values
Oregon's snowpack numbers are historically low. Across 34 SNOTEL stations in this dataset, Oregon averages just 20% of its historical median SWE. Five stations are reporting zero snowpack. Clackamas Lake, Cold Springs Camp, Daly Lake, Santiam Jct., and Bigelow Camp all show no snow where the historical average calls for 10 to 25 inches at this date. Roaring River, which should carry over 26 inches of SWE by mid-March, has 3.8 inches — 14% of normal. McKenzie sits at 22%. The Oregon Cascades are experiencing conditions more consistent with late April or May than mid-March.
The practical implication extends beyond skiing. Oregon's mountain snowpack is the primary water source for agriculture across the Willamette Valley and rivers throughout the western part of the state. A season that finishes at 20% of normal for SWE means rivers run low in summer, reservoir levels stay depressed, and irrigation allocations get cut. The snowpack numbers in March are a preview of the water year.
| Station | State | SWE Today | Should Be | % of Normal |
|---|---|---|---|---|
| Cold Springs Camp | OR | 0.0" | 24.7" | 0% |
| Clackamas Lake | OR | 0.0" | 10.4" | 0% |
| Roaring River | OR | 3.8" | 26.3" | 14% |
| Greenpoint | OR | 0.2" | 15.9" | 1% |
| McKenzie | OR | 7.9" | 36.6" | 22% |
| Cascade Summit | OR | 8.5" | 28.2" | 30% |
| Annie Springs | OR | 13.7" | 34.0" | 40% |
| Summit Lake | OR | 12.3" | 33.6" | 37% |
California, Utah, Nevada: A Similar Picture
The deficit doesn't stop at the Oregon border. California's stations in this dataset average 34% of normal. Palisades Tahoe carries the largest raw deficit of any station in the network — 32.8 inches short of its 48.2-inch average, sitting at just 32% of normal with 15.4 inches of SWE. Echo Peak is at 26%. The Sierra Nevada is running well below what it needs for a normal runoff season.
Utah is averaging 22% of normal across 12 stations. Ben Lomond Trail near Ogden has 0.4 inches of SWE against a 17.6-inch average — 2% of normal. Vernon Creek shows zero. Nevada's stations cluster between 4% and 33%, with Hole-in-Mountain at just 4% of normal. The Great Basin snowpack, already thin by nature, has essentially no buffer heading into spring.
The Washington Cascade Split
Washington tells an internal story of its own. The far north Cascades — Harts Pass, Brown Top — are above normal and thriving. Everything south of there trends progressively worse. Marten Ridge, southeast of Bellingham, is at 43% despite carrying 23.2 inches of SWE — its average is 53.9 inches. Sawmill Ridge is at 36%. Stampede Pass at 51%. Cayuse Pass, one of the best-known stations in the central Cascades, holds 33.2 inches of SWE but sits at just 64% of normal because its average is over 52 inches.
This north-to-south gradient within Washington reflects the season's storm track. Systems coming from the northwest have favored the upper range. The central and southern Cascades — the terrain most Washington backcountry skiers and resorts depend on — have been consistently undercut by warm, wet storms that delivered rain rather than snow at mid-elevation.