Every spring, as snowpack reports roll in, someone makes the connection: good snow year, lower fire risk. Bad snow year, watch out. It's an intuitive link — more snowpack means more soil moisture, slower fuel drying, delayed fire season. But how much does April 1 SWE actually explain when you test it against 40 years of fire data?
We paired April 1 SWE against wildfire acres across 265 HUC8 watersheds from 1985 through 2024 — 4,784 basin-year combinations in total — to find out. The short answer is that snowpack is a real but weak signal. Low snowpack is worth paying attention to. High snowpack is not a guarantee of anything.
How We Built the Dataset
The spatial unit for this analysis is the USGS HUC8 watershed — roughly 1,000 to 3,000 square miles each. Every SNOTEL station and every fire centroid in the contiguous western US was assigned to the basin it falls in. For SWE, we used April 1 snowpack expressed as a percentage of the 1991–2020 historical median — the NRCS standard benchmark, where 100% is normal and below 75% is well below average.
Fire assignment was handled in two ways depending on fire size. Fires under 50,000 acres were assigned entirely to the HUC8 containing the fire's centroid. Fires at or above 50,000 acres — the large complex fires that cross basin boundaries — were clipped proportionally to each HUC8 they overlap using spatial intersection. This approach avoids both over-counting large fires in a single basin and ignoring their actual geographic footprint.
Only basin-year combinations with both a valid SWE reading and at least one recorded fire were included in the correlation analysis, producing 4,784 paired records across 40 years.
What the Numbers Show
At the basin-year level, the relationship is statistically significant (p=0.004) — more snowpack does associate with fewer fire acres — but the R² sits near zero, meaning snowpack explains almost none of the actual variation. At the annual level, where snowpack conditions are averaged across the whole network and compared to total acres burned each year, the R² rises slightly to 3.5% but loses statistical significance entirely with just 40 data points. In practical terms, knowing April 1 SWE tells you very little about how bad the fire season will be.
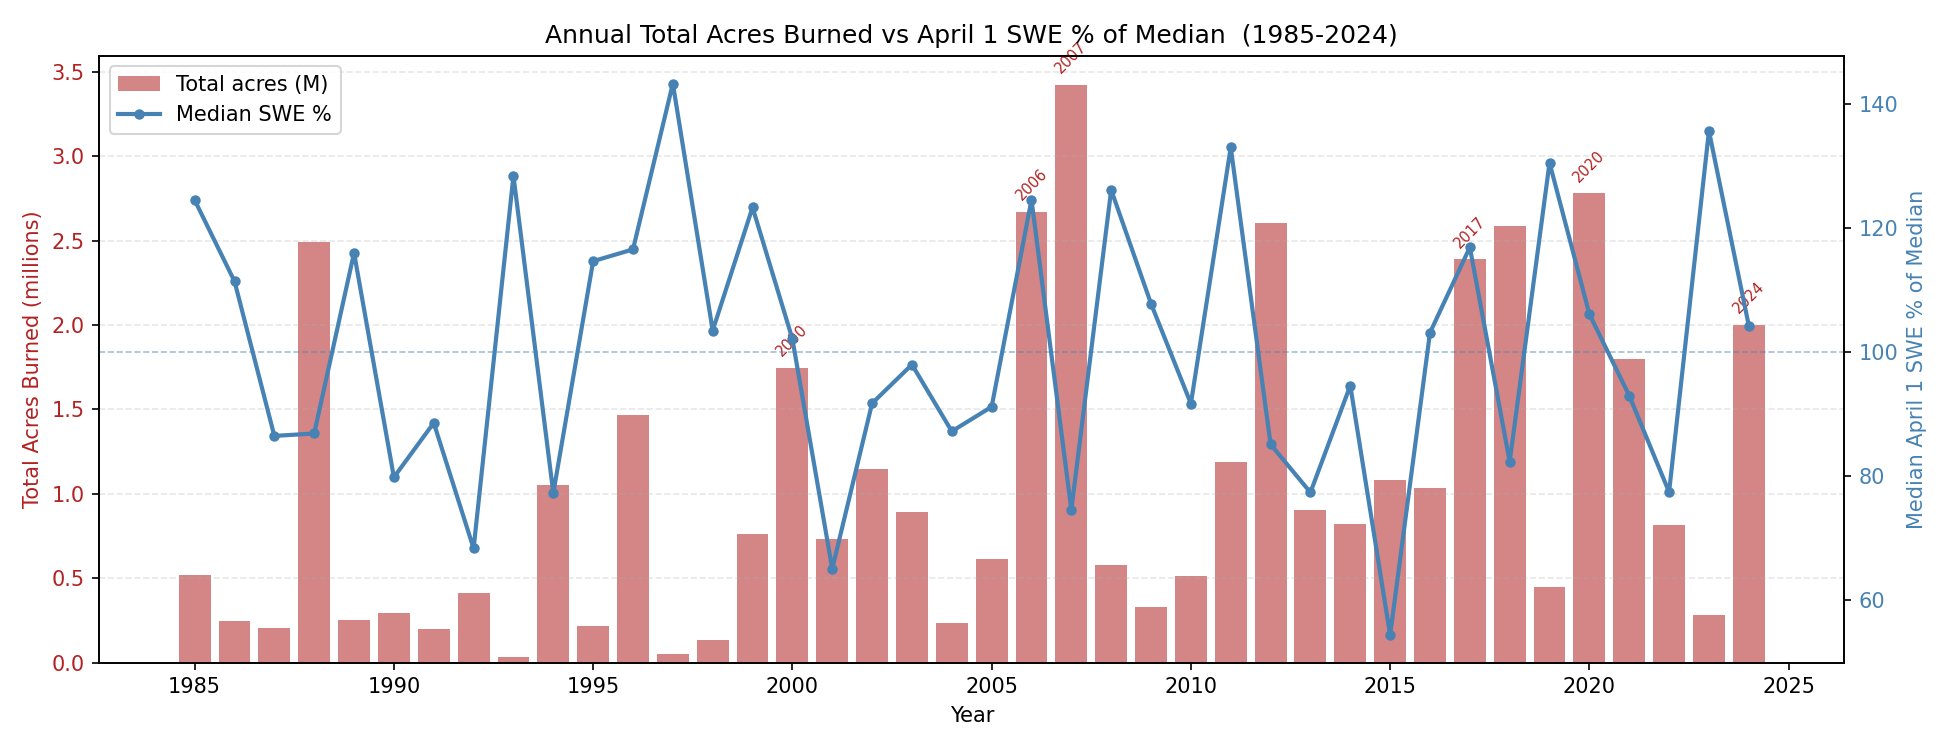
Fig 1 — Annual acres burned vs April 1 SWE % of median · 1985–2024 · Notable years labeled in red · Data: NIFC + NRCS SNOTEL via OutsideDB
A Case Study: 2006
The chart above makes the case better than any regression statistic. In 2006, April 1 SWE across the West was 124.5% of median — a genuinely strong snowpack year. Yet 2.67 million acres burned, making it one of the worst fire seasons in the 40-year record. The same pattern shows up in 2017 and 2020, both above-normal snowpack years that produced 2–3 million acre fire seasons.
The reason isn't complicated: snow melts. By July and August — when the fire season peaks across most of the West — the April snowpack is largely gone. What drives fire behavior in late summer is summer weather: heat, drought, and wind. A strong April snowpack can delay the onset of the fire season by a few weeks, but if summer is hot and dry enough, the fuels dry out regardless of what the mountains held in April.
The map below shows April 1 SWE conditions across the West alongside fire perimeters from 2006 — one of the strongest snowpack years in the dataset, and one of the worst fire seasons. The concentration of blue (above-normal) basins across the Northwest and Intermountain West makes the outcome that summer all the more counterintuitive.
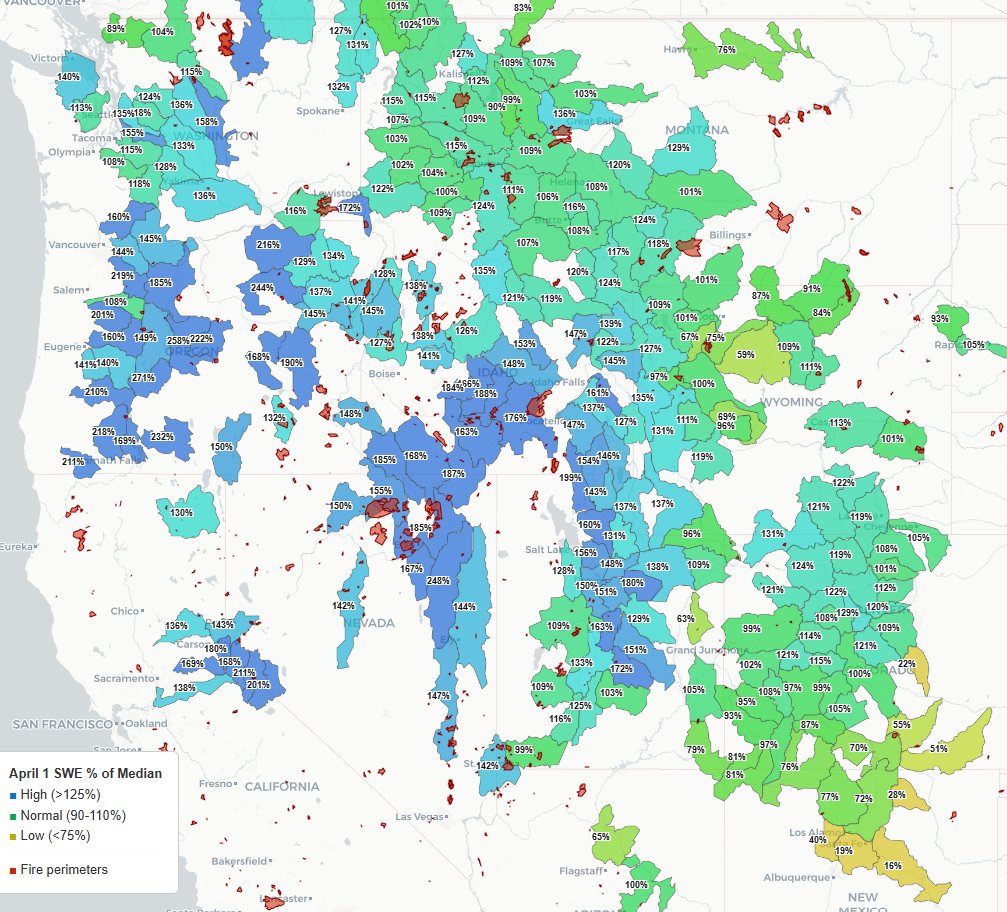
Fig 2 — April 1 SWE % of median by HUC8 basin · Blue = above normal (>125%) · Green = normal (90–110%) · Yellow = low (<75%) · Red outlines = fire perimeters · Data: NRCS SNOTEL via OutsideDB + NIFC
How to Interpret April Snowpack for Fire Risk
High snowpack is not a green light. 2006, 2017, and 2020 demonstrated clearly that above-normal April snowpack provides no protection against severe fire seasons driven by summer heat and drought. Don't let a strong snow year lower your guard.
SWE explains roughly 3.5% of year-to-year variation in fire acres — and that relationship doesn't reach statistical significance with 40 years of data. The other 96% comes from summer weather, fuel loads, ignition patterns, and suppression capacity. April snowpack is one useful piece of early-season context, but it needs to be paired with other indicators for any meaningful predictive value.
The tools that fire and land management agencies actually lean on for seasonal outlooks reflect this. NIFC's Predictive Services team publishes monthly National Significant Wildland Fire Potential Outlooks that weight summer drought conditions — particularly the Palmer Drought Severity Index (PDSI) and Energy Release Component (ERC) — alongside snowpack departure. The USDA Forest Service and NOAA also incorporate vapor pressure deficit (VPD), which captures the drying power of the atmosphere and has shown stronger correlations with fire activity than snowpack alone in recent research. Spring snowpack informs the early part of the outlook season but is progressively replaced by these dryness signals as summer approaches.
All 40 Years: Snowpack vs. Acres Burned
The scatter plot and table below show every year in the dataset ranked from worst to best snowpack. The scatter makes the weak relationship visible — there's a slight downward trend as SWE rises, but the spread at any given snowpack level is enormous. The table color-codes the notable outliers in both directions.
| Year | HUCs | SWE % | Acres burned | Acres (relative) | Note |
|---|